Visualize your grower network. Guide them to be more productive.
Adian.ag gives you full field visibility and the tools to influence outcomes—grounded in biological evidence captured through satellite imagery, historical patterns, and agronomic algorithms.


Empower your Grower Network with Visibility, Influence and ROI
Adian.ag supports Strategic Multi-Grower Operators with the tools to see, guide and measure impact across their entire network.
Full Visibility
Real-time monitoring of all fields in your network—detect issues early, act decisively.
Strategic Influence
Push agronomic programs and product recommendations backed by biological data.
Proven ROI
Measure product impact and grower outcomes with satellite-based validation.
Scalable Efficiency
Manage hundreds of growers with automation and intelligent prioritization.
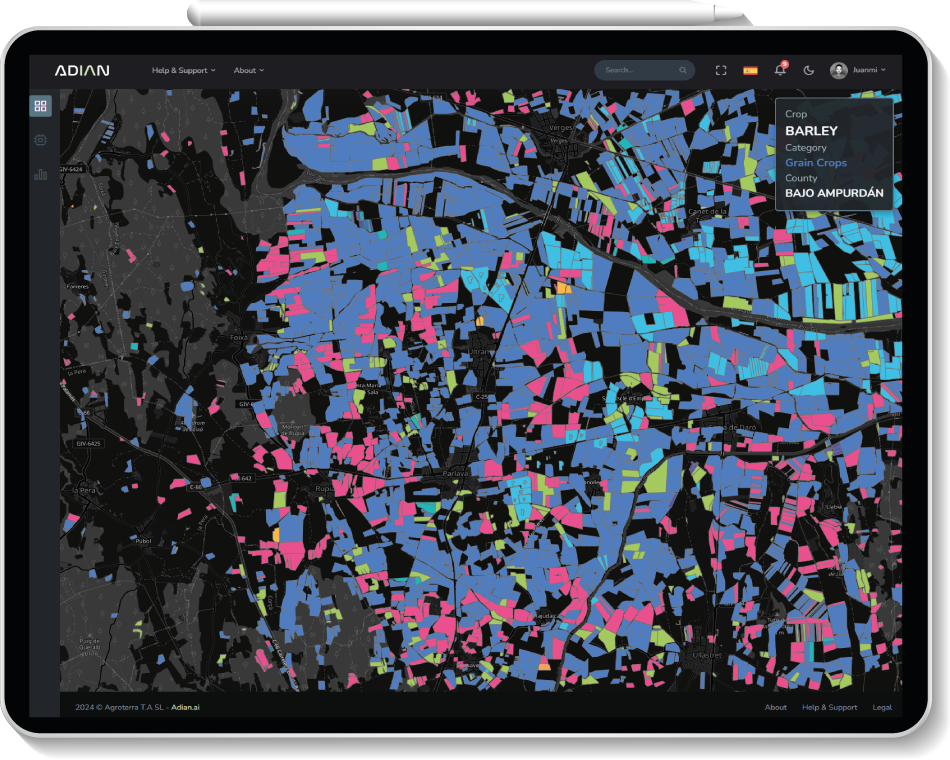
Visibility at Scale: Know What’s Happening ... Everywhere
Adian.ag gives Multi-grower operators full-field visibility across their grower network, detecting anomalies, tracking maturity, and anticipating harvests before problems arise. When you manage hundreds of growers, visibility becomes your strategic advantage.
Empower your team to act with precision, not assumption. Replace scattered observations with a unified, live view of what’s happening in every region and every field.
10+
Satellites configured
for continuous monitoring
50+
Agronomic indicators, algorithms,
and triggers applied at plot level
Full Visibility Means Full Control -> No Surprises
Adian.ag gives Multi-Grower Operators a complete, crop-aware view of everything happening across their network. It’s not just satellite imagery: It’s structured, continuous visibility designed for scale and coordination.
-
See which growers or regions are deviating from expected crop behavior: Not just stress or vigor, but subtle patterns in growth dynamics, maturity timing or canopy development.
-
Track anomalies by segment, comparing similar plots across growers, varieties, or technical programs to identify underperformance early.
-
Get seasonal evolution charts that normalize and align crop cycles, making it easy to compare fields despite staggered planting or different management styles.
-
Spot regional trends before they consolidate, including climate-driven shifts or consistent performance gaps tied to advisory differences.
-
Use consistent field-level data to standardize internal reporting, benchmark grower groups, and guide internal coordination—without relying on anecdotal feedback.
Guide growers. Maximize ROI
Once visibility reveals the opportunities, risks and timing... what matters most is your ability to act on them. Adian.ag helps Multi-Grower Operators transform field-level insights into coordinated, high-ROI decisions across their network of growers.
Influence rooted in real-time insights
-
Align recommendations to stress levels, maturity or crop conditions, at the right time, for the right plot.
-
Launch agronomic programs across hundreds of growers, adjusted by crop and region.
-
Coordinate inputs, pest or disease responses, and bio-based treatments at scale.
-
Track implementation and measure differences in adoption, response, and final yield.
The Complete Solutions
From full-field visibility to precise influence: Everything Multi-Grower Operators need to drive results at scale.
Monitor Grower Progress Across the Network
Track how each grower is advancing through the crop cycle. Identify which ones are ahead or behind schedule to coordinate interventions and optimize harvest planning at scale.
Detect Underperformance Before It Becomes a Problem
Spot growers or zones falling below expected growth patterns early in the season. Act before issues compound, minimizing lost yield and wasted inputs.
Identify Critical Growth Phases by Grower and Region
Recognize when key stages like flowering or maturity are occurring in different zones to time applications and visits with agronomic precision.
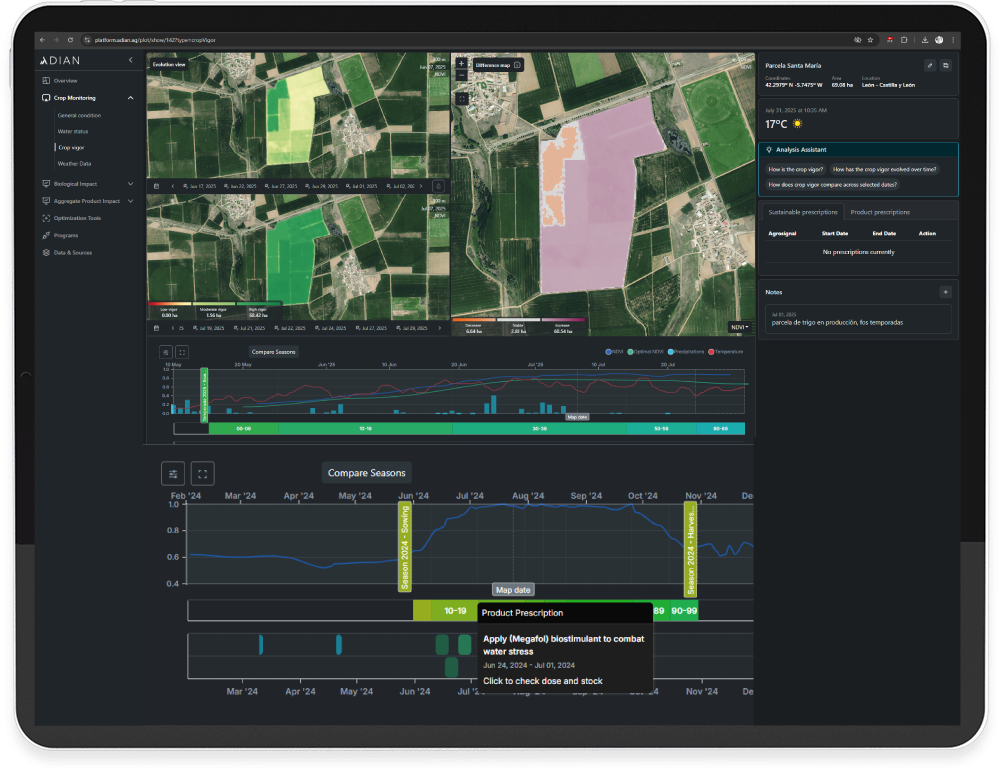
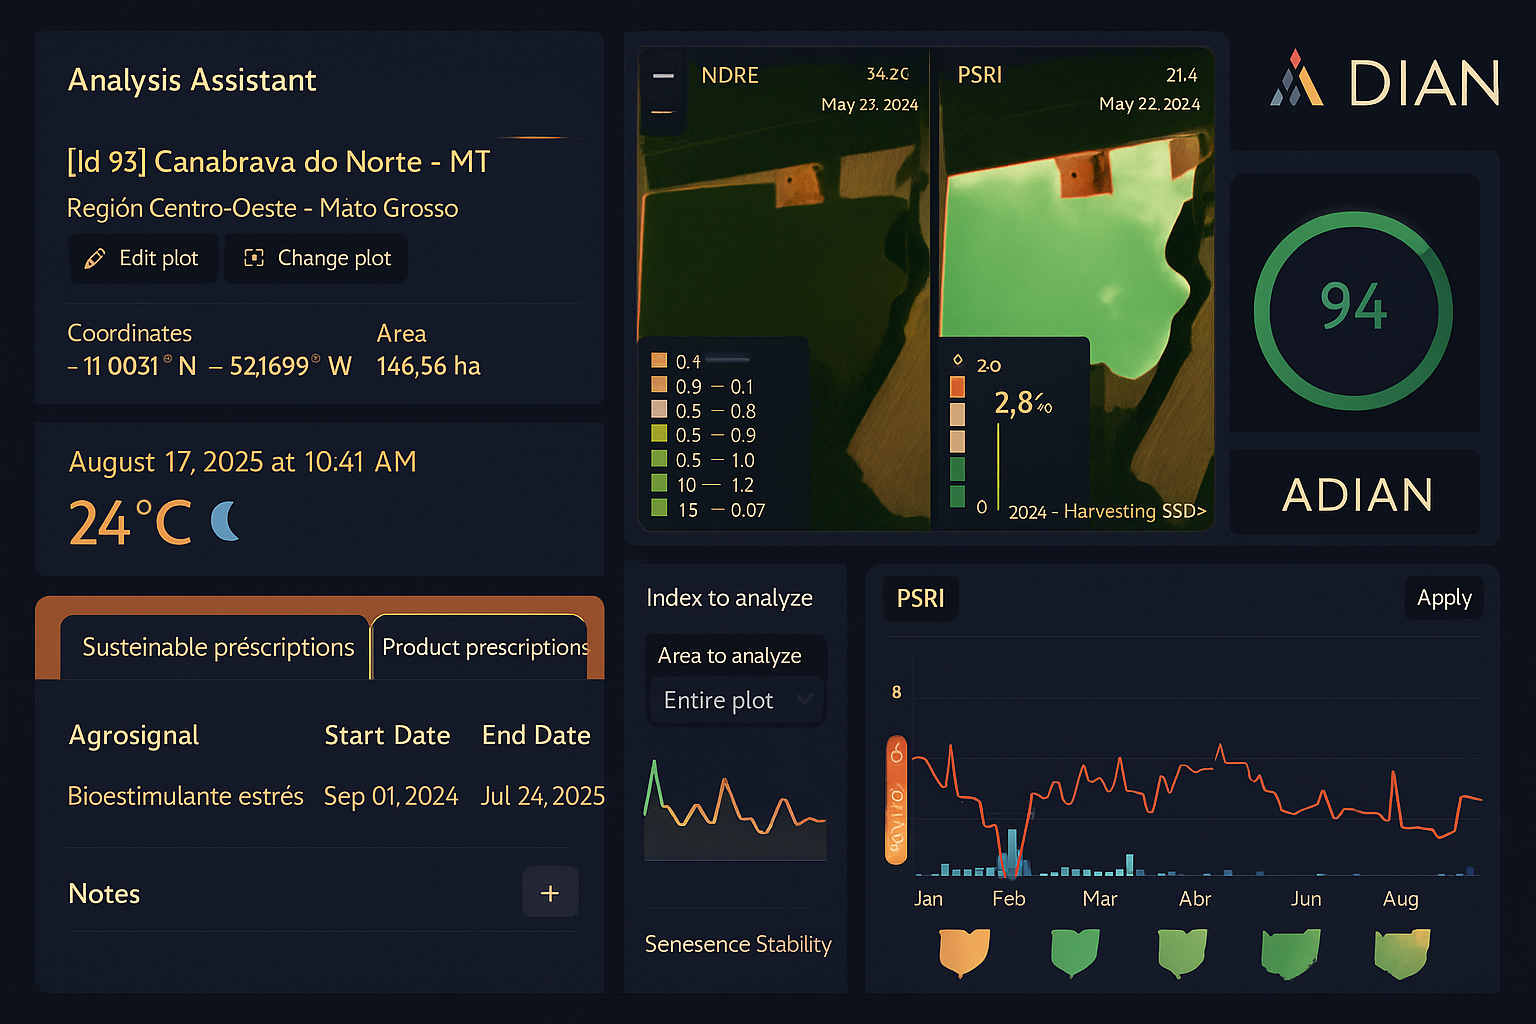
Prescribe the Right Treatment at the Right Time
Turn satellite and field data into real-time treatment recommendations. Trigger bio-stimulant or input applications only when a specific grower, plot, or zone actually needs it—based on detected stress, phenological lag or opportunity.
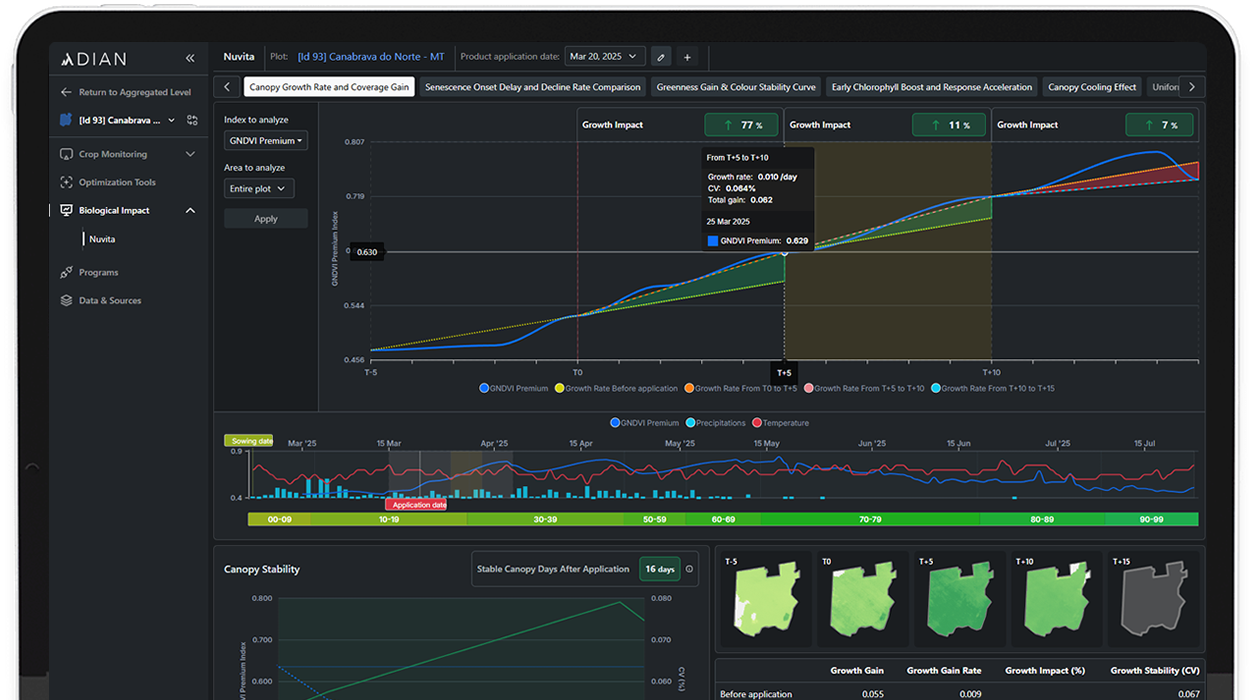
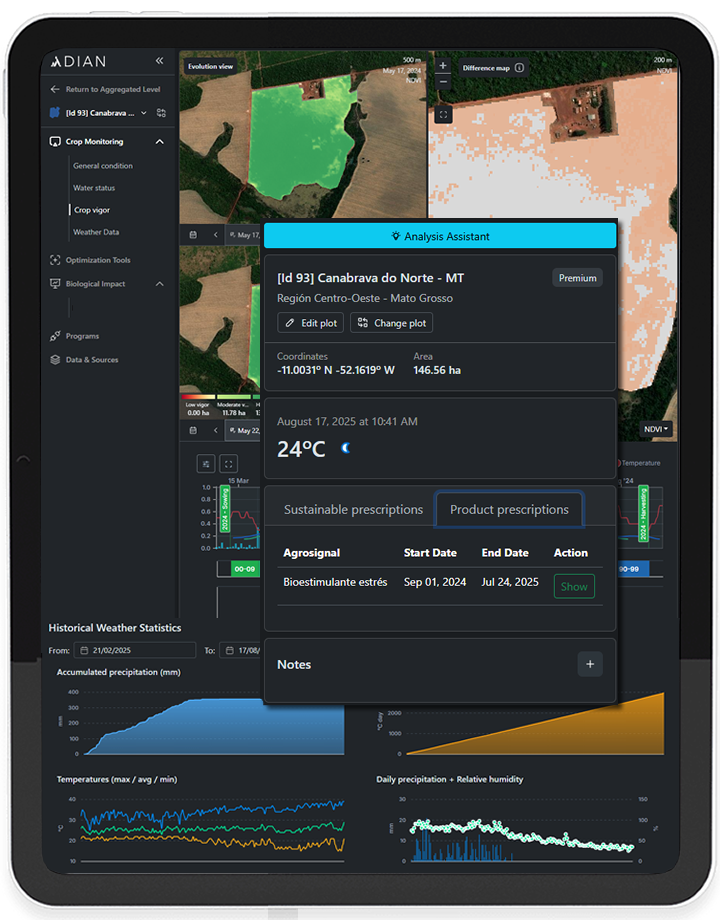
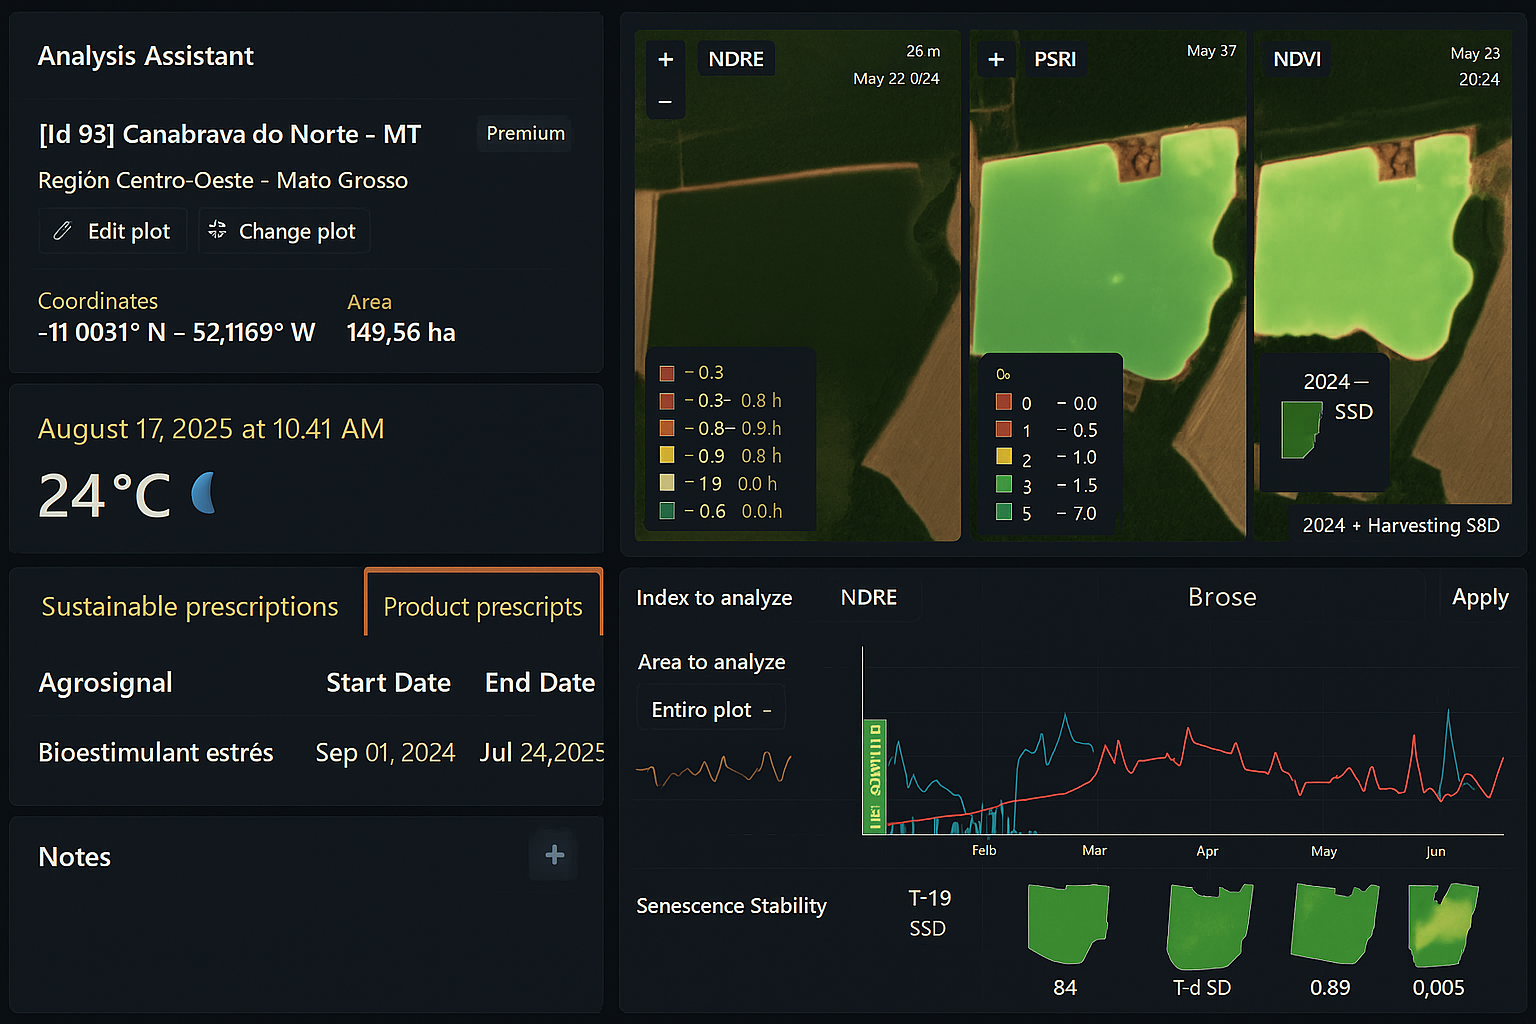
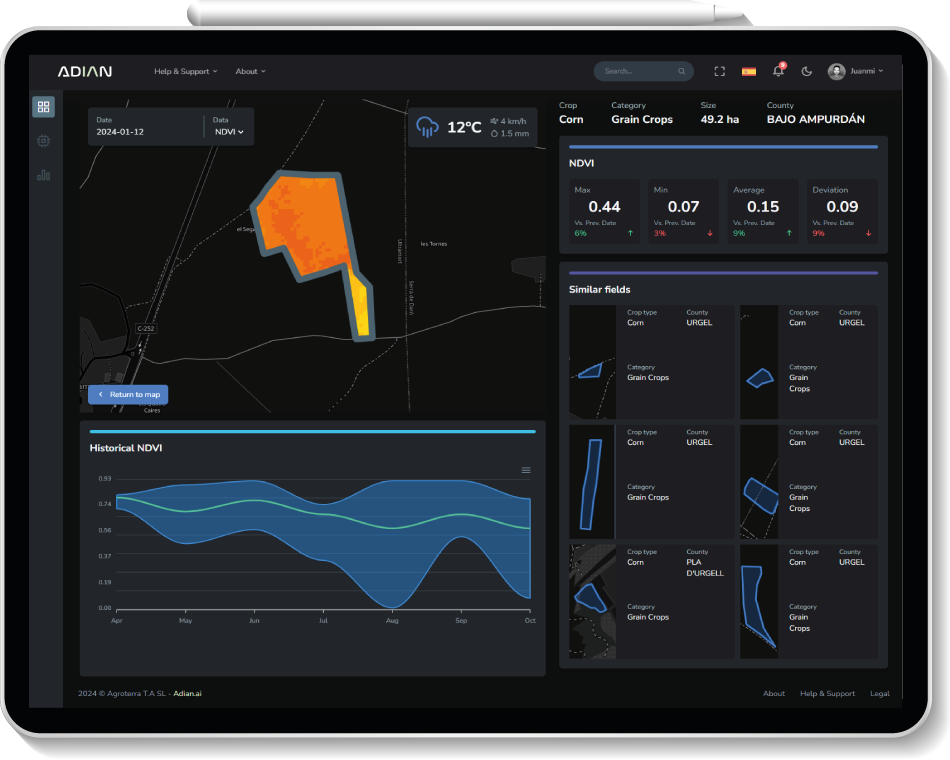
Validate Product Impact: Live and at Scale
See how different products are performing across growers and campaigns, using real field data. Quantify the ROI of each input and adapt your commercial strategy as results unfold, not months later.
Coordinate Field Visits Based on Real Agronomic Patterns
Don’t send your team blindly. Use data-driven alerts to direct agronomists to the right growers at the right moment—whether to apply, verify or adjust. Optimize technical support with maximum impact and minimum cost.
We’ll show you how the platform works with real data from your growers.
Adian for AG Input Manufacturers – A New Paradigm for Real-World Proof
Stop relying solely on field trials. With Adian.ag, you can detect, visualize and validate treatment/product performance in real time—across real growers, in real production conditions. It’s not just evidence. It’s influence, powered by technology.
Product Visibility
See how, where and when your products are used, and what impact they’re delivering in the field.
Market Influence
Use data to drive adoption, build credibility and differentiate your biological portfolio.
Distributor Enablement
Equip your commercial and technical teams with real-world data to support every recommendation.
ROI Tracking
Measure and communicate the return on investment of your products across crops, regions and conditions.
Beyond Trials: Turn Variability Into Advantage
Adian.ag enables input manufacturers to move beyond isolated field trials and capture how products perform in real production conditions: Across growers, geographies, and management styles. This isn't about replacing trials. It's about scaling your evidence with real-world variation.
While others wait for results, you act on them. The shift is happening... and if you're not capturing this data, someone else is.
Real-time Local Proof
Show real product impact on nearby growers, while it's happening.
Scale Evidence
Compare results across crops, zones, and campaigns effortlessly.
Smart Prescriptions, Real Impact
Turn data into action. Trigger agronomic decisions exactly where and when they matter most: to maximize ROI.
-
Go beyond alerts. Prescribe treatments in real time, based on agronomic logic and real field conditions.
-
Apply only where needed, track results, and justify every recommendation with measurable impact.
Empower Distributors
Help your distribution network move from theory to impact. With Adian.ag, your technical and commercial teams gain access to real production data (at plot level, across growers) to support every recommendation with confidence.
Empower your Commercial Teams
Give your technical and commercial teams real-world data to support every recommendation.
-
Turn product impact into field-based credibility: Visible to growers, not just marketers.
-
Equip your network to sell with confidence, using proof instead of promises.
Satellites powering Adian.ag
Multiple constellations, diverse resolutions, real-time precision.


Explore Satellite Entities
Powerful indicators already configured and ready to scale.
10m Wind Speed
Mean wind speed at a height of 10 metres above the surface over the period 00h–24h local time.
2m Relative Humidity
Describes water vapor in air as % of saturation level. Based on multiple local-time observations.
2m Temperature
Sensitive to chlorophyll in late-stage crops. Useful for crop monitoring.
Precipitation Flux
Daily rainfall total per area unit (mm/day) from 00h–24h local time.
SAVI
Reduces soil brightness in vegetation index for sparse crops.
OSAVI
Optimized SAVI index with further soil influence reduction.
SI
Soil Index indicating moisture and general conditions.
Bare Soil Index
Differentiates bare soil from vegetation coverage.
CAI
Cellulose Absorption Index: identifies cellulose or lignin presence.
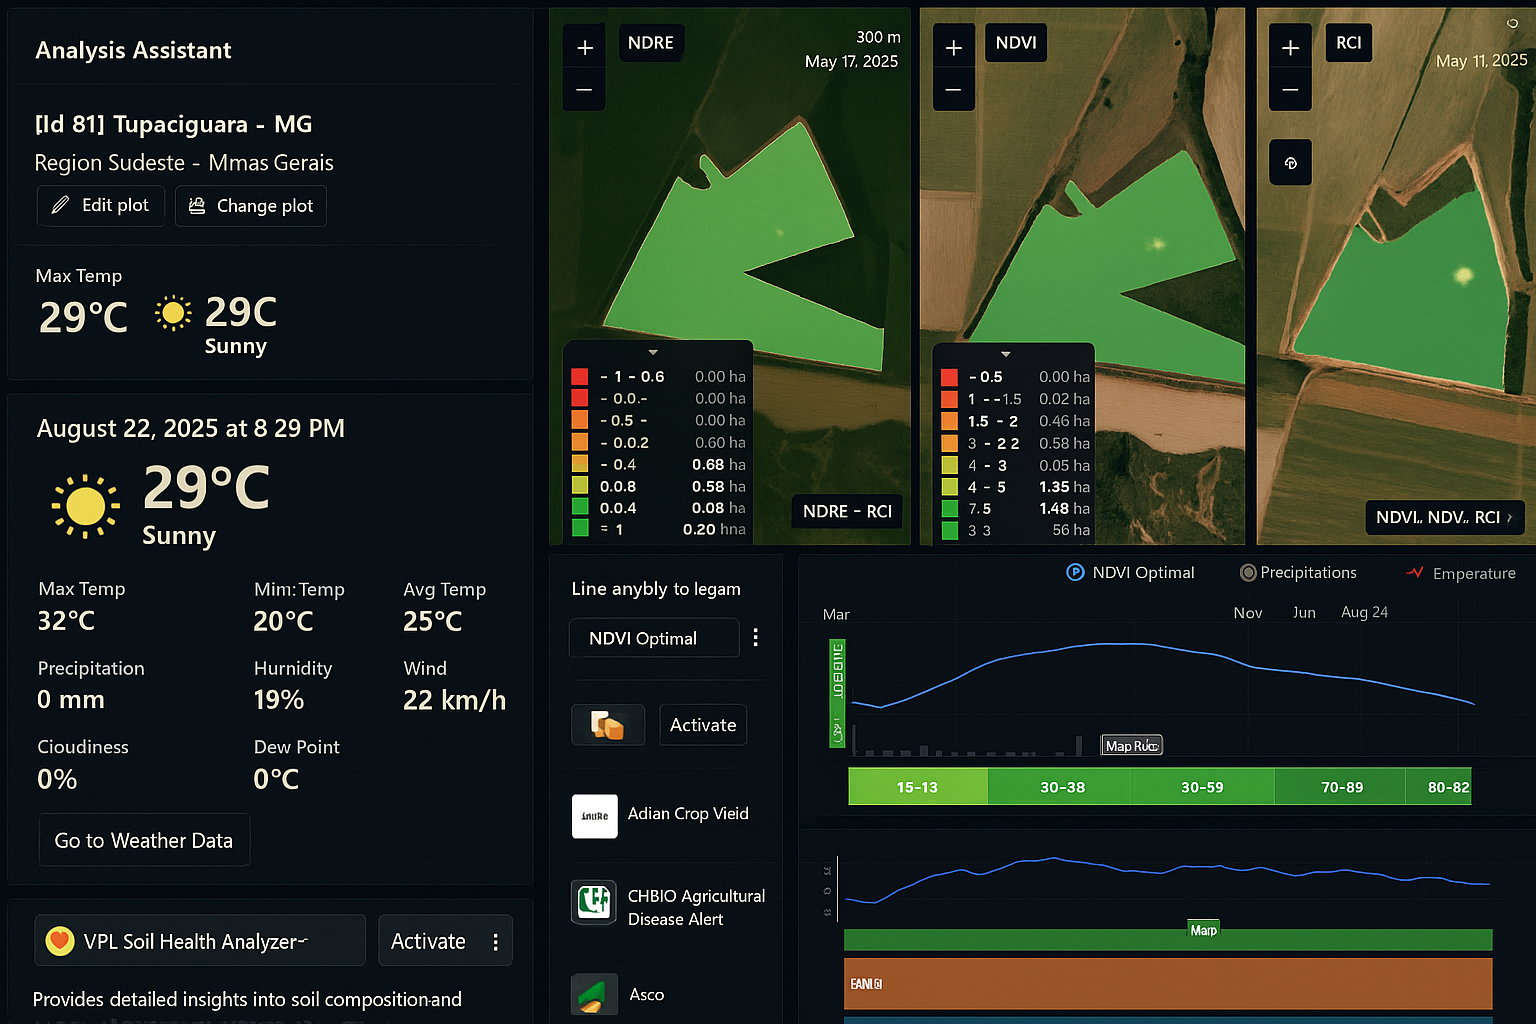
NDRE
Sensitive to chlorophyll in mature crops. Uses NIR + red-edge bands.
GNDVI
Indicates nitrogen status and crop vigor via green reflectance.
CHI
Chlorophyll Index using NIR and red-edge to assess vigor.
PRI
Photochemical Reflectance Index: measures photosynthetic efficiency.
TCARI
Highlights chlorophyll absorption and early stress signs.
DCNI
Double-peak Nitrogen Index using red-edge bands.
mND705
Modified ND705: chlorophyll content measurement.
mSR705
Modified Simple Ratio 705: chlorophyll concentration.
CCI
Tracks both canopy chlorophyll and nitrogen levels.
MCARI
Modified Chlorophyll Absorption Ratio Index.
NDVI
Normalized Difference Vegetation Index: growth and stress.
EVI
Enhanced Vegetation Index: removes atmosphere/soil noise.
MTVI2
Modified Triangular Vegetation Index: crop growth/vigor.
NBR
Normalized Burn Ratio: biomass levels and fire stress.
NDWI
Assesses plant water stress using NIR + SWIR.
NDWI_1240
NDWI variant with SWIR 1240 nm: precise water stress mapping.
NDWI_1640
NDWI using SWIR 1640 nm: improved canopy water estimation.
WET
Wetness Index: composite for water + soil moisture levels.
TC (True Color)
Generates RGB-based views similar to human visual perception.
Nitrogen
Estimates plant nitrogen to guide nutrition and yield potential.
Potassium
Detects potassium deficiency patterns impacting plant health.
Phosphorus
Assesses phosphorus availability and root development support.
Methane
Tracks methane emissions across agricultural and wetland zones.
Plans Designed for Impact
Tailored to growers, networks, and manufacturers who act on data.
Large Grower
Up to 300 hectares free
Crop monitoring and alerts
Product application tracking
ROI and impact dashboards
Qualification: for growers managing 100–300 hectares. → Ideal for advanced growers ready to digitalize their decisions.
Multigrower Operator
First 1,000 hectares fully free
Custom onboarding for your team
Pilot-to-success: pay at scale
Access all core features
Qualification: for Multigrowers that work with several growers in their network, and need to guarantee product quality, ROI and Productivity.
Manufacturer/Distributor
First 50 growers/distributors free
Real-time product validation
Pilot-to-success: pay at scale
Share results with your network
Qualification: must include at least 1 biological, CP or fertilizer product. Ideal for brands seeking data-driven market influence.
We’ll show you how the platform works with real data from your growers.
FAQs: Is Adian the Right Fit for You?
Explore how Adian helps multigrowers and manufacturers turn complexity into clarity, and visibility into action.
-
How can I monitor hundreds of growers without losing control?
Adian gives you visibility at scale. Instead of scanning indices, you get curated insights about delays, stress patterns, or lack of activity — all organized by growers or zones. It’s like having a digital agronomist scanning your entire network, every day.
-
Can I detect underperforming plots or growers before it's too late?
Yes. Our platform identifies anomalies, outliers, and delays early, based on crop vigor, senescence trends, and other indicators. You get alerts, not maps, so you can act fast where it matters most.
-
Can the system help me decide where to start harvesting or fertilizing first?
Absolutely. Adian helps you prioritize operations based on phenological status, field variability, and historical trends, not just your calendar. That means optimized logistics, lower costs, and better crop timing.
-
Can I actually influence how and when growers act?
Yes. Adian transforms visibility into influence. You can create targeted alerts, recommendations, and agronomic programs that growers receive in real time, creating alignment across your entire network.
-
Do I need agronomic expertise to use the platform effectively?
Not at all. Adian is designed for strategic operators, not agronomists. We translate satellite and algorithmic complexity into clear, simple insights and actions, crop by crop, region by region.
-
How can I prove my product’s impact, beyond isolated field trials?
With Adian, you can monitor product performance across real fields, growers, and regions, not just trial plots. It’s real-world validation, at scale, and in real time. That’s the new standard.
-
Can I see the real-time performance of my product across different growers and regions?
Yes. Adian tracks canopy growth, greenness, cooling effect, vigor (and much more) to quantify the impact of your biologicals or fertilizers across all fields where they’ve been applied. All visible in a unified dashboard.
-
How do I support my distributors to sell smarter and faster?
Equip them with visibility and proof. Distributors can show product performance live, push prescriptions with data behind them, and answer objections with real field results, not brochures.
-
Is it possible to generate ROI metrics automatically, not manually?
Yes. Adian automatically links application data to outcomes, enabling you to estimate ROI by grower, plot, or campaign. No Excel sheets, no assumptions. Just impact.
-
We already use satellite tools: What makes Adian different?
We’re not a satellite tool. We’re a strategic platform that uses satellite data(among other sources) to create business value. While others show you maps, we show you where to act and how to grow.
Can’t find the answer to your question?
Contact us and we’ll get back to you as soon as we can.